The days inventory outstanding formula
Both forms give the same answer as long as your inventory turnover ratio is calculated on a cost basis. If you calculated turnover using revenue instead of COGS, a very common error, the second formula will hand you a DIO roughly half of what it should be.
Average inventory is beginning inventory plus ending inventory divided by two, both at cost. If your business is seasonal, and in apparel it is, average your monthly ending balances instead. A two-point average spanning a Q4 peak and a January trough describes neither.
DIO = (Average Inventory ÷ Cost of Goods Sold) × 365
DIO = 365 ÷ Inventory Turnover Ratio
A worked example
Your COGS last year was $900,000. You started January at $180,000 in inventory at cost and ended December at $120,000.
The average unit sits about 61 days between arriving and shipping. Cutting that number is the job of the inventory tools I build for stores.
Average Inventory = ($180,000 + $120,000) ÷ 2 = $150,000 DIO = ($150,000 ÷ $900,000) × 365 = 60.8 days
Why DIO is more useful than turnover
Turnover gives you a count: "we turned 6 times." Days gives you something you can put next to another number and draw a conclusion.
The comparison that matters is your supplier payment terms. At 61 days of inventory and net 30 terms, you're paying for goods a month before they generate cash. That gap is financed out of your own working capital, and it's the reason growing businesses run out of money while profitable.
Line up DIO against days payable outstanding and days sales outstanding and you have the cash conversion cycle, the actual number of days your money is tied up. Cutting 20 days of DIO is equivalent to a 20-day interest-free loan the size of your inventory, granted permanently.
What is a good DIO?
Category-dependent, and the honest answer requires knowing which formula the benchmark used.
Publicly traded apparel and footwear companies have recently shown inventory turnover of roughly 3.2x on a cost-of-sales basis and 6.3x on a sales basis. Those correspond to DIO of roughly 115 days and 58 days respectively, for the same companies, in the same period. A separate analysis of retail financial statements puts apparel and footwear turnover at 3.99, or about 92 days.
Which is right? The cost-based figure. But notice that a benchmark table quoting 58 days and one quoting 115 days can both be honestly derived from identical data. Always confirm the denominator before you compare yourself to a published number.
Practically: large public retailers carry more inventory than you do, because they have stores. A lean multi-channel operation should be targeting materially better than the public-company average: 45 to 60 days is a reasonable band for apparel and footwear, and it's where a well-run operation lands.
Where DIO stops being useful
DIO is a period metric. It describes what already happened, at the level of the entire business. Neither of those properties is compatible with a reorder decision. You can't reorder the average. You reorder a variant, this week, based on what it's doing now.
- It's blended. a 61-day DIO can be the average of variants at 15 days and variants at 200 days. The good ones and the dead ones cancel out and produce a number that looks fine. This is the most common way an inventory problem stays invisible in a business that looks healthy on paper.
- It's backward-looking. DIO is calculated from a trailing period. If demand shifted six weeks ago, DIO won't reflect it for months. An inventory aging report shows the shift by receipt cohort while it is still cheap to act on.
- It's in the wrong units for buying. buyers work in weeks and in lead times. "Sixty-one days" isn't a purchase order.
Weeks of supply: the operational version
For actual replenishment, use weeks of supply.
Use a trailing four-to-eight-week window for the sales rate. Four weeks is more responsive and noisier; eight is more stable and slower to react. In a seasonal category, eight weeks spanning a season change will lie to you, so shorten the window at transitions.
Example: 120 units on hand, selling 15 a week. Weeks of supply = 8.0. Now it's a decision. If your supplier lead time is six weeks and you want four weeks of safety stock, your reorder trigger is 10 weeks of supply. You're at 8. You're already late. Amazon's in-stock rate inside the IPI score is graded from the same trigger.
That's the difference. DIO tells you the business held 61 days of inventory last year. Weeks of supply tells you this specific variant needs a PO today. Run both: report DIO, operate on weeks of supply.
Weeks of Supply = Current Units On Hand ÷ Average Units Sold Per Week
| DIO | Weeks of supply | |
|---|---|---|
| Direction | Backward-looking | Forward-looking |
| Level | Company or category | Variant |
| Input | Historical COGS | Current on-hand ÷ recent velocity |
| Answers | How efficient were we? | Do I reorder this now? |
| Audience | Finance, lenders, board | Buying and ops |
Two adjustments for multi-channel
Two failure modes show up once the same variant is listed in more than one place.
- Don't average across channels. the same variant can have eight weeks of supply on blended sales while one channel accounts for 80% of that velocity. If that channel changes its algorithm or you lose the buy box, your eight weeks becomes twenty-four overnight.
- Split by location. weeks of supply at the company level is meaningless if the units are in the wrong warehouse. A variant with ten weeks nationally and one week at the location that ships most of its orders is going to stock out while the report says it's fine. The free consultation checks both before anything gets reordered.
Frequently asked questions
- What is the days inventory outstanding formula?
- DIO equals average inventory divided by cost of goods sold, multiplied by 365. It can also be calculated as 365 divided by your inventory turnover ratio. Both give the same answer when turnover is calculated on a COGS basis.
- What is a good days inventory outstanding?
- It depends heavily on category. Publicly traded apparel and footwear companies have recently run inventory turnover between roughly 3.2 and 4.0 on a cost basis, which corresponds to DIO of roughly 90 to 115 days. Leaner direct-to-consumer operations frequently target 45 to 60.
- What is the difference between DIO and weeks of supply?
- DIO is backward-looking and calculated from a period of historical cost of goods sold. Weeks of supply is forward-looking and calculated from current on-hand divided by recent weekly sales rate. DIO reports on the business; weeks of supply drives the reorder.
- How do you calculate weeks of supply?
- Divide current units on hand by average units sold per week over a recent trailing window, typically four to eight weeks. The result is how many weeks the current stock will last at the current rate.
- Is lower DIO always better?
- No. Very low DIO usually means you're stocking out, and lost sales don't appear anywhere in the DIO calculation.
Weeks of supply, per variant, per channel
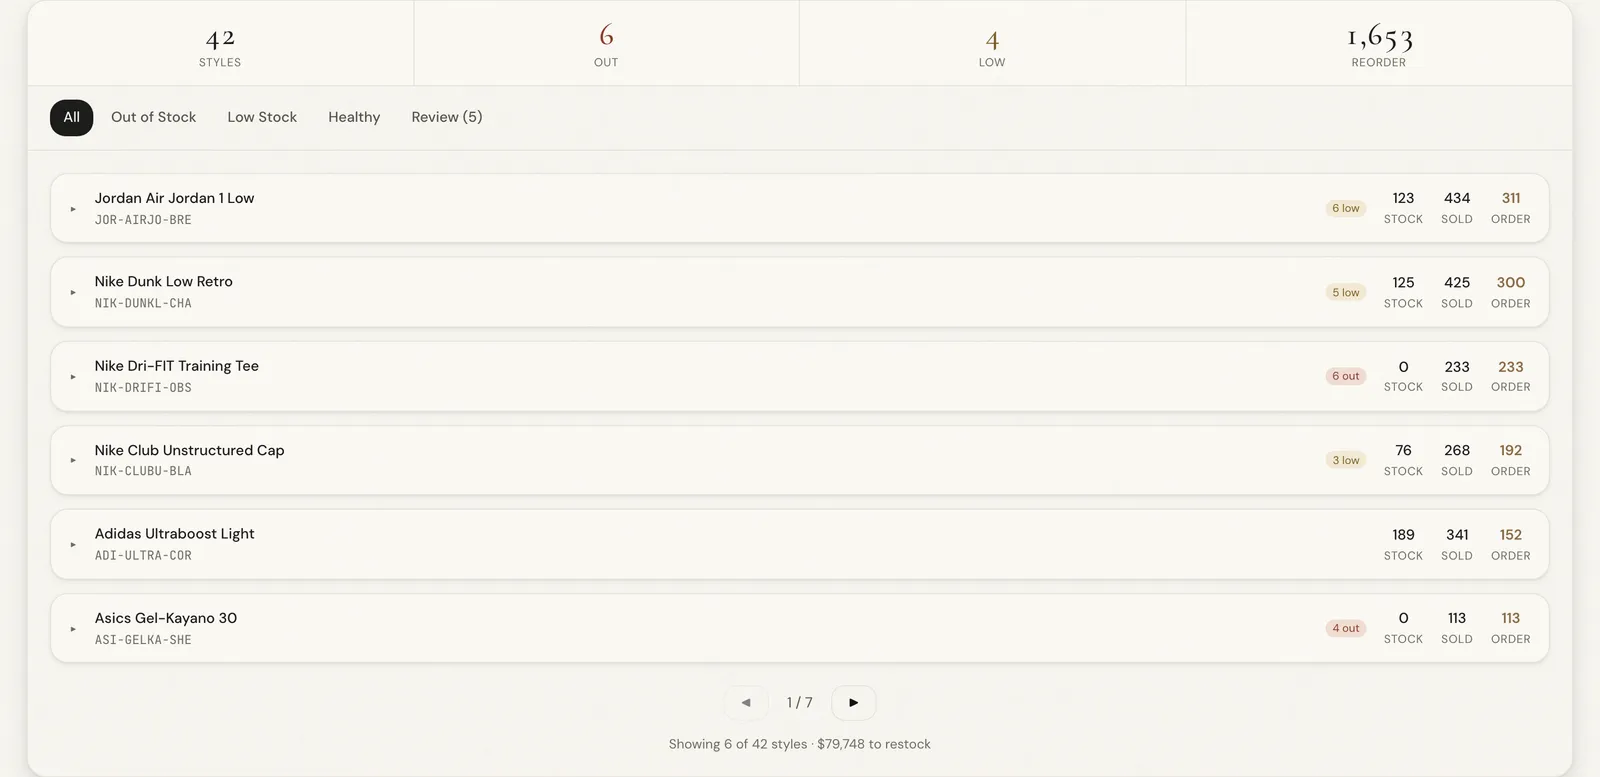
The Inventory Health Dashboard calculates days of supply at the variant level and grades each one on age and velocity alongside it, so you see the reorder candidates and the markdown candidates in the same view instead of reconstructing both from exports.