Tool demo · Margin
Custom P&L Software
True profit per marketplace after every channel's fees, shipping, and ad cost, and the best channel to route each product to.
The problem
Every marketplace exported a different spreadsheet, and the small fees hid across dozens of columns. Closing the month meant reconciling Shopify and seven marketplace exports by hand, and the blended margin at the end looked fine even when one channel was quietly handing its profit back in returns. Accounting software saw revenue and a lump of fees; it could not say what a channel actually paid.
The tool
- Takes the sales and shipping exports from each marketplace as they come, no reformatting
- Pulls cost basis from the inventory system and maps SKUs automatically
- Nets out commission, payment and cashout fees, per-order flats, shipping labels, and ad spend per channel
- Shows profit by channel and by product, and which channel each product should route to
- Works backwards from the payout you want to the list price that gets there on each channel
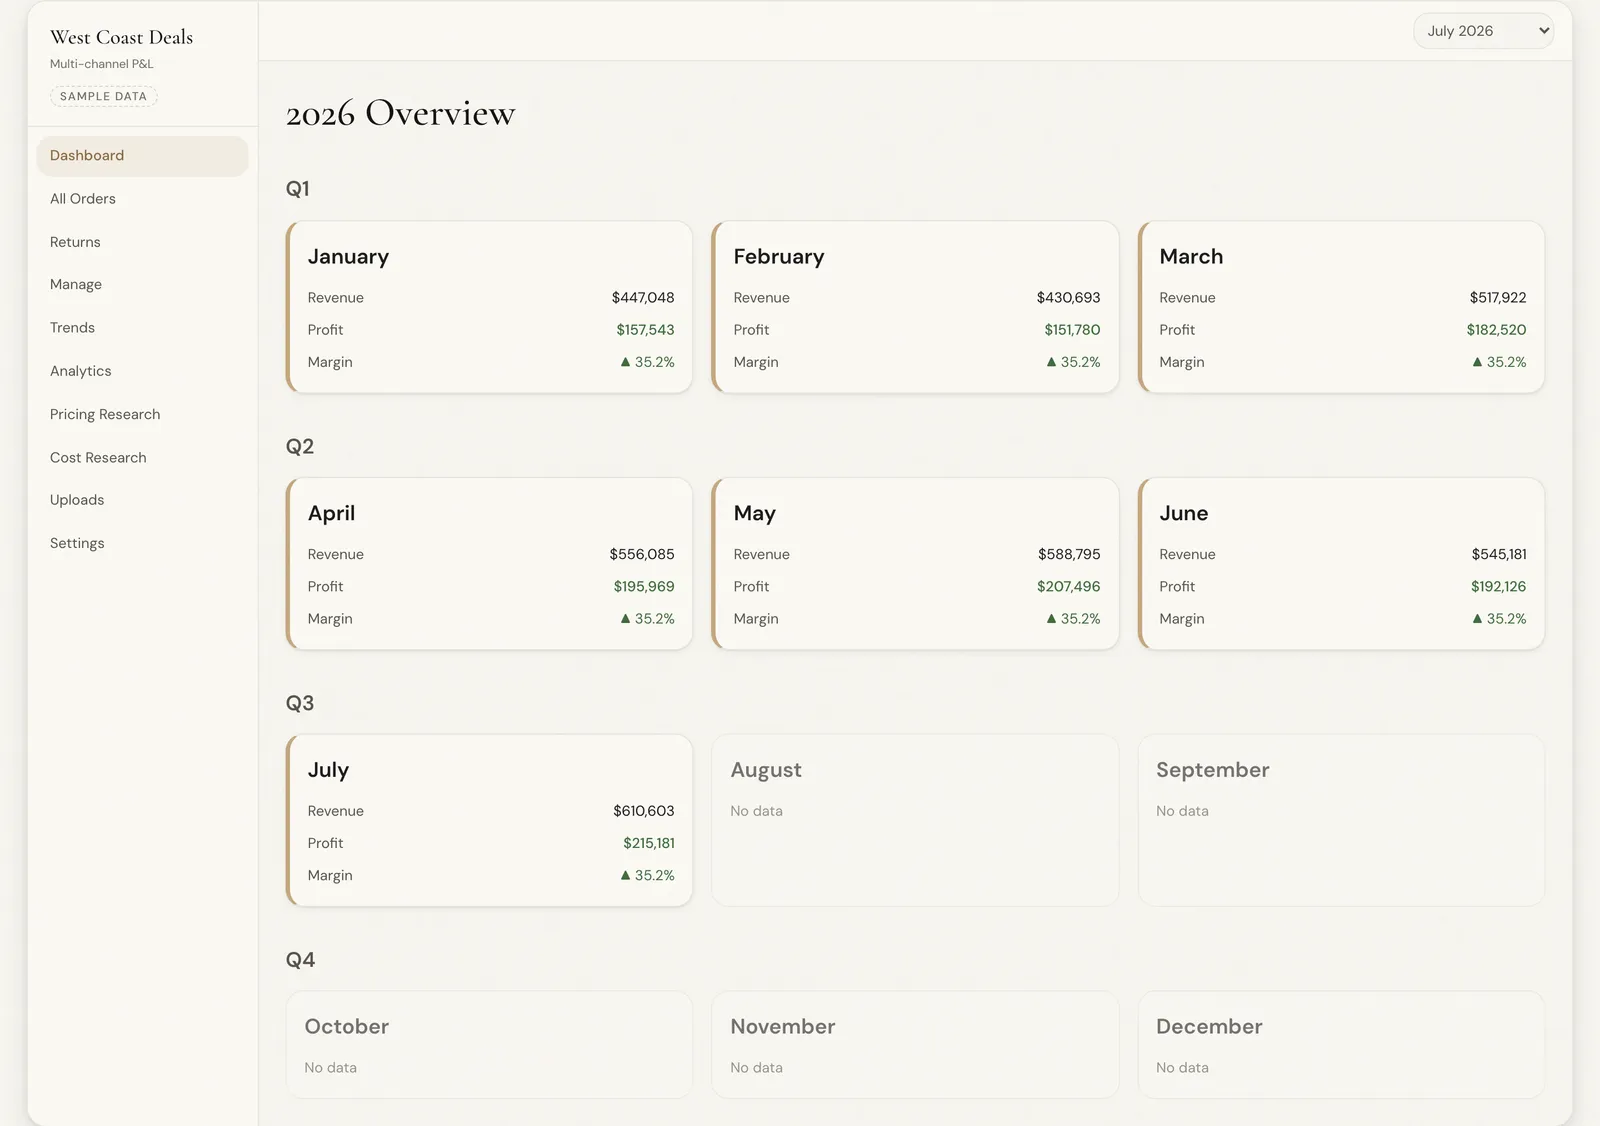
About the data below: this demo is branded West Coast Deals because that's the store it was built for, but every figure in it is invented, a fixed sample catalog, not live or historical trading data. The logic is the real thing; the numbers are not.
2026 Overview
Q1
Q2
Q3
August
No data
September
No data
Q4
October
No data
November
No data
December
No data
How it works
Every channel takes its cut differently
The fees differ in shape as well as size, which is what makes channel profit easy to misread. StockX and GOAT bundle commission and payment fees into a single payout and ship the item for you, so the only other cost is goods. GOAT adds a 2.9% cashout fee on withdrawal. Shopify charges under 3% plus thirty cents, and you pay to ship every order and to acquire the customer. eBay takes over 13% and a flat fee, and gives a free shipping label above a price threshold. SHEIN and TikTok sit in the middle on fees and leave the shipping to you. Line them up and the cheapest channel is rarely the one you would guess.
From payout to real profit
Per-order profit is a short ladder: start with the sale price, subtract the channel's fees for the actual payout, then subtract the cost of goods, the shipping you paid, and any acquisition cost. Roll that up across every unit and channel and you have a profit and loss statement by channel: units, gross sales, fees, cost of goods, shipping, net profit, and margin. The workspace in the demo above is a full month: the company summary ledger, a card for every channel, and, one click in, the transaction table behind it. The number on the channel card, the number in the summary, and the total at the foot of the table are always the same, because they are the same calculation.
Then returns. SHEIN, TikTok, and eBay hand back a share of every month's sales, and a return does more than reverse the payout. You often pay the return shipping and the handling on top. A channel that looks healthy on gross sales can turn thin once its refund rate is included, which is why profit is measured net of returns, per channel, so the losers cannot hide behind the winners in a blended average.
Route each product to the channel that pays
Once net profit per channel per product is visible, a decision falls out of it: list each item where it nets the most. A high-ticket sneaker often does well on a marketplace that ships for free and charges a modest commission. A low-cost tee does well on your own store or a low-fee social channel where a flat shipping cost leaves the margin alone. The gap between a product's strongest and weakest channel is real money, captured by listing smarter.
Why a spreadsheet cannot keep up
Channel fees change, payout formulas differ per platform, shipping rules have thresholds, and cost of goods shifts with every purchase order. Doing this by hand is a monthly slog that is stale the moment it is finished. A system that ingests each channel's payout export, matches it to real landed costs, and applies the right fee formula per channel turns the slog into a live statement.
The result
- Time saved
- 210 hrs → 3
- a month of accounting and receipt entry, across Shopify and seven marketplace exports
The time is the smaller half. The bigger half is seeing margin by channel every month instead of guessing which channels pay and which hand it all back in returns.
license
License Custom P&L Software for $149 a month, with a $450 setup.
Net profit per marketplace from your payout exports and landed costs, updated each month.
- A one-time setup fee where one is listed, then month to month with 30 days notice.
- Setup covers connecting your accounts, loading your data, and the first two weeks. The monthly license starts when the tool is live.
- A change to the logic is a custom build, quoted after the free consultation.
Want this for your business?
The examples are retail because that is where I built them. The same build applies to scheduling, job costing, or field reporting. The consultation is free, and the price is fixed before the build starts.